Currently Browsing All Posts In Market Update

Monday January 19, 2015

2014 Market Review In Headlines

US_Stock_Market_Performance


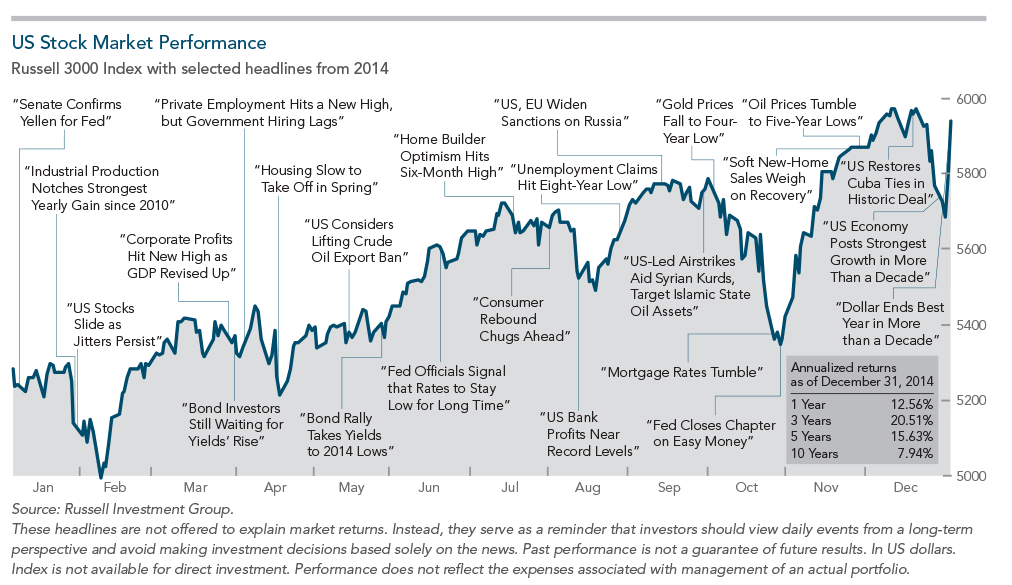
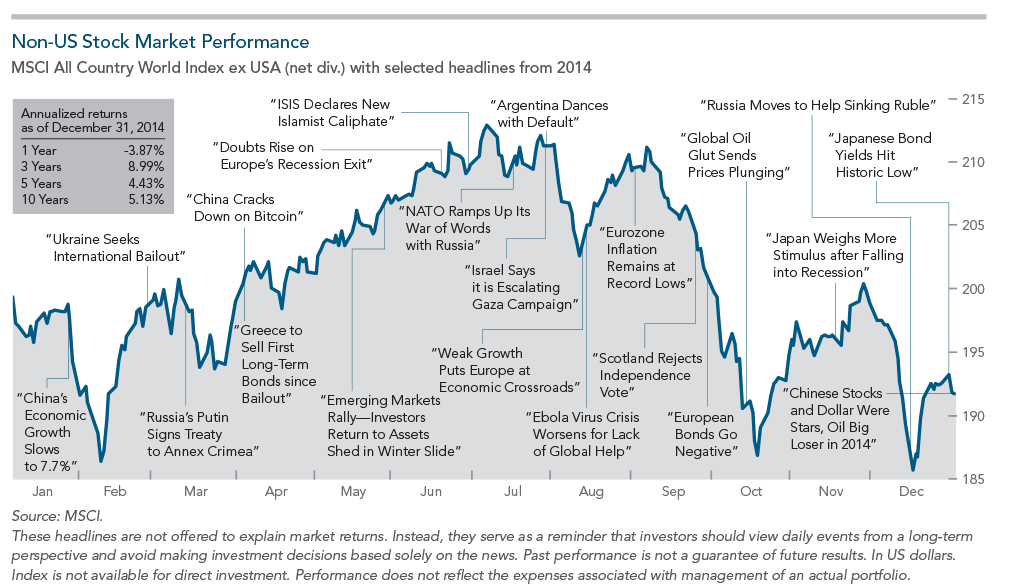
The chart above highlights some of the year’s prominent headlines in the context of broad US market performance, measured by the Russell 3000 Index. These headlines are not offered to explain market returns. Instead, they serve as a reminder that investors should view daily events from a long-term perspective and avoid making investment decisions based solely on the news. The next chart offers a snapshot of non-US stock market performance (developed and emerging markets), measured by the MSCI All Country World Index ex USA. Again, the headlines should not be viewed as determinants of the market’s direction but only as examples of events that may have tested investor discipline during the year.

Non_US_Stock_Market_Performance


Within my financial advisory practice, I’ve been discussing how tilting towards different parts of the market has delivered above market returns (referred to as a “premium”). If you missed it, you can read more HERE (scroll down a bit). What investors should understand is that these above average returns aren’t consistent over time. Last year, US large cap stocks significantly outperformed small cap stocks, and within the relative price dimension, large value slightly outperformed large growth. Among small cap stocks, growth outperformed value. Negative returns among large and small caps stocks were similar, while large growth slightly outperformed large value. In the emerging markets, small cap, which had a slightly positive return, outperformed large cap, and growth outperformed value, although both returns were negative.

Major_World_Indices

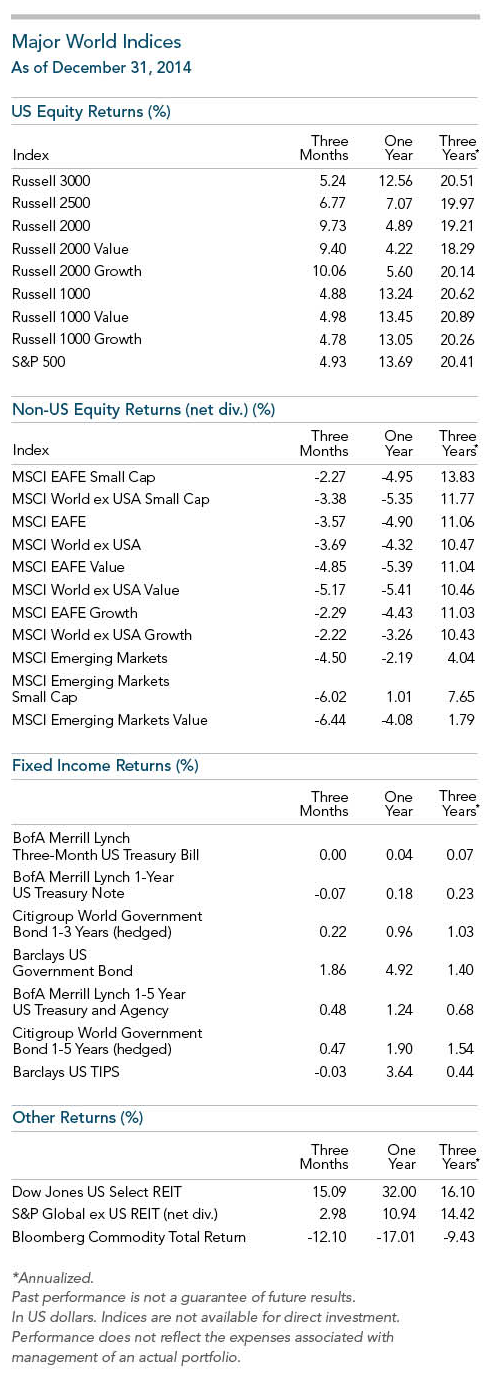
The mixed results of the size and relative price in 2014 were not unusual from a historical standpoint. Although small cap and value stocks have offered higher expected returns relative to their large cap and growth counterparts, these return premiums do not appear each year. For example, since 1979, US small caps have outperformed large caps in 19 of the 36 calendar years—or 52% of the time. Results are similar for the relative price dimension: Since 1979, value has outperformed growth in 20 calendar years—or 55% of the time. Small cap value has outperformed large cap growth in 58% of the calendar years.

History also has produced multiyear periods in which small caps and value did not outperform large caps and growth. Noteworthy periods include 1984 to 1987 and 1994 to 1998, when small caps underperformed large caps, often by a wide margin each year. Since 1979, the value premium has also experienced extended periods of underperformance—and, in some cases, the differential exceeded 15% margin. The same is true of small value vs. large growth stocks. In the three-year period from 2009 to 2011, both value and small caps underperformed. Yet, despite even extended negative-premium periods, small caps and value have outperformed over time, and when the premiums reversed, they often did so strongly and in multiple years.

Whatever happens in 2015, don’t be surprised. The market is unpredictable, so accept it. It can drop 10% in a week and then recover to finish the month strong. The headlines tracking these ups and downs can evoke very powerful emotions. It’s no wonder so many investors get caught up the mania we’re all bombarded with. Just remember, if your long term plan is solid, don’t change it based on short term news.

Thanks for reading and have a great day!

Greg Lessard, CRPC®

Logo 2014


Tuesday November 11, 2014

How Market Declines Lead To Advantageous Portfolio Rebalancing

There’s room for portfolio rebalancing improvement among fund managers and financial advisors. In this video I’ll explain why investors can’t get hung up on declines on individual investments in their portfolios, and why these temporary declines may present strategic rebalancing opportunities. If you have questions about your specific situation please reach out to me. The strategies I discuss in the video apply in any investment account (401k, IRA, or taxable account).

Please click the image below to start the video. Thank you.

Screen Shot 2014-11-11 at 11.08.40 AM

Wednesday November 5, 2014

Will Stocks Rise Based On Midterm Elections?

Screen Shot 2014-11-05 at 8.25.08 AMI enjoy looking at historical events and how they’ve shaped market returns. Tuesday’s midterm elections saw Republicans overtake Democrats for control of the Senate, giving them full control of Congress. In my state of Colorado, governor Hickenlooper has effectively defeated Republican challenger Bob Beauprez as most all the ballots have been counted as of 8 AM this morning. The state Senate seat went to Republican challenger Cory Gardner, who defeated incumbent Mark Udall for his spot. While midterm elections are important, I’m thankful all the annoying flyers and tv spots are over. Just let me watch the Broncos lose in peace…

Looking back at midterm election years, investors have usually seen an end of year rally in the stock market. Some of this is fueled by the traditional seasonal market tailwind (I think everyone is in a better mood during the holidays, and therefore more likely to buy) in November and December. Since WWII, the stock market has averaged 16% growth in midterm election years. The S&P 500 is already up 9% YTD, so 16% may be a tall order by December 31st, but you never know. Occasionally, stocks have slumped from midterm election day through year end. This happened in 2002, 1994, and 1986 when the market lost -4%, -1.4%, and -1.6% respectively, in the final two months of trading.

What’s interesting is looking at whether a Democrat or Republican winning election favors better year ending stock market returns. Democratic investors would think they’d have an advantage when they win, and no doubt Republicans would feel the same way about their party. However, the data is just about evenly split. It really doesn’t matter what party wins. The stock market tends to rally a bit regardless of election results! This is probably due to the perception of change and the optimism it brings to investors. Whatever happens over the next two months, nothing is changing with portfolio models at my company. Making any change based on short term outlooks (good or bad) is a form of market timing intelligent financial advisors don’t subscribe to. Thanks for reading and have a great week!

Tuesday October 14, 2014

Why You Should Love A Diversified Portfolio: Video

Here’s a short video I made today illustrating how various indices ended on Monday, October 14th. Although US large cap stocks took somewhat of a heavy beating, many of the other asset classes commonly used in any diversified portfolio fared better.

Click the image below to learn why you should love a diversified portfolio during market volatility. Make sure to watch it in HD for best results.

Screen Shot 2014-10-14 at 3.28.13 PM

If you have any questions regarding the underlying rationale for the market’s behavior or if you’re using the correct asset allocation please contact me. Thanks for watching!

Wednesday October 8, 2014

Market Update, October 8th 2014

The market has pulled back about 3% from its recent high point. Slow global recovery is the main culprit driving the S&P 500 down. However, there are a few bright spots including a strengthening dollar, new Federal Open Market Committee meeting notes reaffirming the Central Bank’s intent on prudency with rate increases, and today enjoying the largest one-day gain from US stocks all year. 

Click the image below to watch the analysis. Please watch in HD for best results.

Screen Shot 2014-10-08 at 2.31.19 PM


If you have any questions or feel like a conversation about risk is warranted, please reach out to me. Thanks for watching!

Thursday September 25, 2014

Can You Commit To Your Asset Allocation?


What if the chart below represented the next 12 months of stock market returns?

Screen Shot 2014-10-14 at 3.47.20 PM

You’re actually looking at the elevation profile for a mountain bike race I did last August. I used this graph because I wanted to have a little fun, and there’s no denying it represents a bumpy ride whether you’re on a bike or invested in the market. It’s well known that in order for an investor to achieve a return, one must take risk. Risk is measured by volatility, and it’s how an investor reacts to this volatility that can dictate whether or not they achieve a good long term result.

Let’s assume the market plays out like the chart above. Attaining the top of the big spike in the middle represents the euphoria an investor feels after a stock market run up like the one in the late 90’s, ’03-’07, and ’09-today. Using the horizontal numbers for reference, what happens when an investor gets to mile 52? They usually get a little nervous and start questioning if this dip represents a recession. Once they get to mile 55 they are probably panicking hard, and on the verge of selling to go hide in cash or Treasuries. By mile 58 they are so exasperated they finally sell, and that’s the worse thing they can do.

Even though they feel better, they’ve actually just locked in their losses. So now what? They know they need growth in their accounts, but now they have to decide when to get back in. How long will it take them to regain confidence? Are they ready by mile 70, 85, or 104? The issue with my hypothetical investor is they sold when things were the worst, and waited too long to get back in. The other issue is this investor isn’t all that hypothetical. Investors have been doing this for decades.

An investor needs to understand the potential risks to their investments, and then commit to their asset allocation choice for the long term. Long term in the investment world should represent a time period lasting more than at least 10 years. The first step in determining an acceptable level of risk to take is by completing a risk questionnaire. The point of risk questionnaires is to establish a starting point for an asset allocation decision. Let’s assume the results of the questionnaire suggested an “aggressive” allocation.

The more critical step is to then correctly interpret what the risk questionnaire is suggesting. To accomplish this, let’s assume the aggressive investor adopted a 90% stock / 10% bond allocation model. What would they say when I showed them the historical returns of the recommended allocation?

Screen Shot 2014-10-14 at 4.33.24 PM

The most critical step is to either accept the recommended asset allocation or adjust to a less risky allocation. Many times an investor who is aggressive on paper isn’t actually up for accepting that kind of loss. Risk and asset allocation should be determined by a questionnaire along with a potential real world scenario.

A good financial advisor will not only guide you into an appropriate asset allocation, but they’ll be there when you’re at mile 55 & 60, panicking because you forgot your investment objectives were long term. A good financial advisor truly earns their fee when they help keep you calm during market downturns, and always takes time to explain why your asset allocation is still valid for your risk profile, long term investment objectives, and financial planning goals.

Thanks for reading! Feel free to leave a comment below or reach out to me directly if you have concerns about the investment risk you’re currently taking.