Monday November 24, 2014

The Things I’m Thankful For

IMG_1661

We’re all reminded this week to remember what good things in life we’re thankful for. Around the Thanksgiving table, people share things like their family, friends, income, experiences, house, health, and so on. I’ve made it a point (or at least tried) to thank you for your business, as well as the opportunity to earn your business since starting my newsletter and blog. I hope you feel I truly value whatever level of engagement we have. This will be a short post (we’re all preoccupied this week) as I clarify what business and financial thanks are most important to me.

The Profession of Financial Advice

This December will mark my 11th year working with clients explaining financial strategies I believe in. Each year that passes I find even more attraction to the field of personal finance. In 2014 I spent more time working on my own expertise than any other year. I’m thankful for a continued and compelling drive to be a better advisor. Additionally, thank you to capitalism for making stock markets work. And last, thank you to all my technology partners helping me deliver a better client experience.

My Negative Experiences In The Industry

This one may seem odd, but it’s valid and deserves an explanation. A few times in my career I’ve been humbled by my own ignorance and lack of foresight. I won’t go into detail (you’ll have to take me out drinking to get the full stories), but what’s important to know is the few bad experiences I’ve had have shaped who I am and how I behave today. Although extremely painful at the time, I’m thankful for those negative experiences as they’ve taught me the right way to behave and treat people, versus acting childish, petty, or selfishly for personal gain.

The People Who Believed In Me When I Struck Out On My Own

Most important is Melissa, my wife of almost 7 years. Greg&Melissa rehearsalHere’s the last photo taken of us before we got married. Despite a few faults as a companion, shortcomings in business, and lack of patience as a parent, she’s always supported me. I couldn’t have had the courage to leave a comfortable position with a big name brokerage company to try something better without her unwavering verbal and mental support. I also need to mention my parents, Bruce & Leanor (who some of you know), who were highly influential back when I started the company. Last, I’m very appreciative of the 30 clients who initially came to Aspen Leaf Partners from my old brokerage firm. I’ll never forget what one client said in a phone call he initiated to me a few days after I resigned. Andrew is still a client today, and since none of you know him it’s ok to repeat his words. “Greg, please tell me you’re still working as an advisor. I got a call from someone at your old office, and the person who called me really rubbed me the wrong way. Where are you now and how quickly can I move my money?” was what came out his mouth before I even had a chance to speak. Thanks to those 30 folks who believed in me (everyone is still with Aspen Leaf Partners minus one sweet old lady who passed away this summer), as well as all the new clients that have come on board since. You’re all very special in my heart, and I’m thankful to have relationships with each of you!

I hope y’all (sorry, I just returned from Texas 36 hours ago) have a fantastic week celebrating with the special folks in your life. Know that at my dinner table I’ll be speaking about how important you are to my company as well as me personally.

Thank you,
Greg Lessard, CRPC®
Founder & President

Logo 2014


Tuesday November 18, 2014

How To Insulate Your Portfolio When Markets Decline

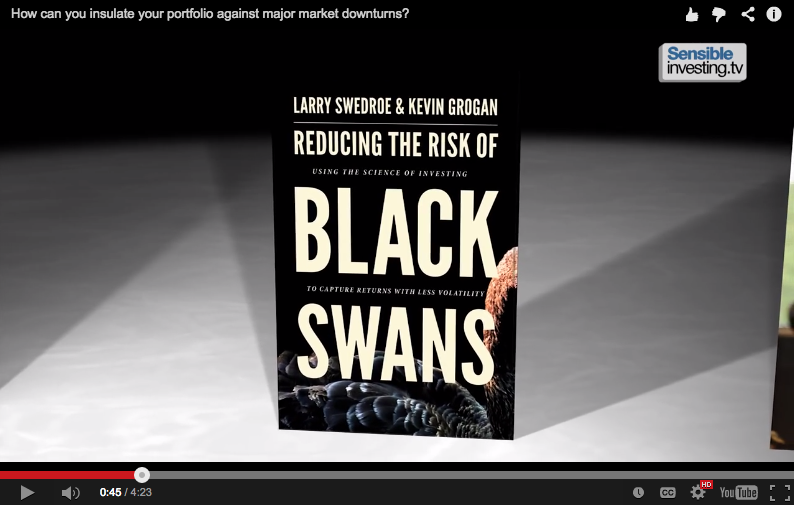
The financial credit crisis proliferating during 2008 was considered a “black swan” market. If you’re not familiar with the term, a black swan is any event that deviates from a normal expected outcome, making it difficult if not impossible to predict. Investors were rightfully shocked by losses the market suffered in 2008, and many panicked, only recently getting back in. Two financial advisors based on St Louis recently released a book describing how an investor can learn from the 2008 black swan market, as well as practical advice on how to design a portfolio that can help insulate your portfolio when markets decline. I’ve ordered the book for myself and if interested, you can find it HERE.

If you don’t have time or patience for the book (I don’t blame you), a friend and colleague of mine recently released a short video discussing the book’s highlights. Click the image below to watch the video.

Screen Shot 2014-11-18 at 9.51.32 AM

Now that you’re an expert on how an overweight in value and small cap equities can reduce a diversified portfolio’s statistical bell curve tails (hahahhahah that was fun to say), let’s explore how this can be implemented and what its effect is on your long term financial plan.

HOW TO IMPLEMENT THIS STRATEGY

If you work with my financial advisory practice, we’re already doing this to an extent. I’ve been researching the benefits of overweighting value stocks and small cap stocks for over a year. Today I’m flying to Austin, TX to attend a two day workshop covering this portfolio design to cap off my studies. If you don’t work with my advisory practice, you can implement this with your own accounts at a discount brokerage like eTrade, TD Ameritrade, or Scottrade. Some 401K plans even have a robust enough fund lineup to employ the strategy. Your first step is to determine your target allocation (based on risk capacity, investment time horizon, general level of anxiety, etc), then go a bit more conservative by using a higher allocation to less volatile assets like bonds. Since bonds tend to drag on long term returns, you’ll want to mitigate the loss of return by overweighting to value stocks and small cap stocks. This can be accomplished using very specific mutual funds, or even better, index funds and ETFs. Many times a fund’s name will identify what type of strategy it sticks to. If you get stuck on finding these types of investments within your 401k or brokerage firm, ask me. I won’t charge you a fee, and I won’t hound you to death to become a client. Just making deposits in my karma bank.

WHY BOTHER DOING ANY OF THIS

Because if you’re nearing retirement or recently retired (5-10 years plus or minus), the sequencing of your portfolio returns matters! Research studies show how your portfolio behaves around the time you retire influences your ability to generate income. Here’s an example; if you retire and your portfolio takes a beating, it can take a long time to recover. Over the short term (3-7 years), a severe enough beating may rob you of a higher level of investment income you might have otherwise enjoyed. Over the long term (more than 10 years), your overall level of investment income will likely end up lower (with the portfolio beating) than had you taken steps to reduce investment risk. This is just another example of how managing risk in your investment portfolio makes a difference when looking at the big picture.

Thanks for reading my blog, and remember to share it with anyone you think would benefit from the content. Contact me if you want any additional information on this topic. Have a great day!


Tuesday November 11, 2014

How Market Declines Lead To Advantageous Portfolio Rebalancing

There’s room for portfolio rebalancing improvement among fund managers and financial advisors. In this video I’ll explain why investors can’t get hung up on declines on individual investments in their portfolios, and why these temporary declines may present strategic rebalancing opportunities. If you have questions about your specific situation please reach out to me. The strategies I discuss in the video apply in any investment account (401k, IRA, or taxable account).

Please click the image below to start the video. Thank you.

Screen Shot 2014-11-11 at 11.08.40 AM

Wednesday November 5, 2014

Will Stocks Rise Based On Midterm Elections?

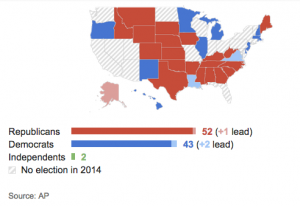
Screen Shot 2014-11-05 at 8.25.08 AMI enjoy looking at historical events and how they’ve shaped market returns. Tuesday’s midterm elections saw Republicans overtake Democrats for control of the Senate, giving them full control of Congress. In my state of Colorado, governor Hickenlooper has effectively defeated Republican challenger Bob Beauprez as most all the ballots have been counted as of 8 AM this morning. The state Senate seat went to Republican challenger Cory Gardner, who defeated incumbent Mark Udall for his spot. While midterm elections are important, I’m thankful all the annoying flyers and tv spots are over. Just let me watch the Broncos lose in peace…

Looking back at midterm election years, investors have usually seen an end of year rally in the stock market. Some of this is fueled by the traditional seasonal market tailwind (I think everyone is in a better mood during the holidays, and therefore more likely to buy) in November and December. Since WWII, the stock market has averaged 16% growth in midterm election years. The S&P 500 is already up 9% YTD, so 16% may be a tall order by December 31st, but you never know. Occasionally, stocks have slumped from midterm election day through year end. This happened in 2002, 1994, and 1986 when the market lost -4%, -1.4%, and -1.6% respectively, in the final two months of trading.

What’s interesting is looking at whether a Democrat or Republican winning election favors better year ending stock market returns. Democratic investors would think they’d have an advantage when they win, and no doubt Republicans would feel the same way about their party. However, the data is just about evenly split. It really doesn’t matter what party wins. The stock market tends to rally a bit regardless of election results! This is probably due to the perception of change and the optimism it brings to investors. Whatever happens over the next two months, nothing is changing with portfolio models at my company. Making any change based on short term outlooks (good or bad) is a form of market timing intelligent financial advisors don’t subscribe to. Thanks for reading and have a great week!

Tuesday October 28, 2014

When Mutual Fund Managers Mimic An Index, Investors Lose.

If investors are going to pay significantly higher fees than an index fund, shouldn’t they expect significantly different holdings than the appropriate benchmark index? If a mutual fund holds similar holdings as its underlying benchmark, after expenses the mutual fund typically underperforms the index.

The Trend

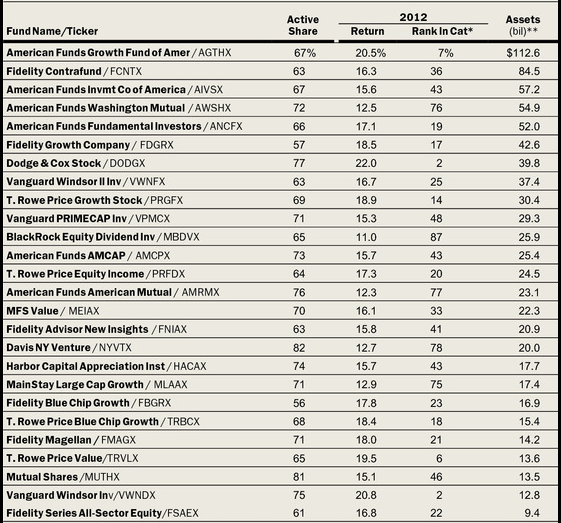
In a 2009 study, Antti Petajisto suggests that mutual funds that hold at least 40% different holdings than their benchmarks are statistically truly active. Taking data from Morningstar, we can see that the 25 largest mutual funds barely constitute “actively” managed. This is measured by a relatively new statistic called Active Share. On a scale of 0 to 100, a score of 0 equals perfect correlation to an index whereas a score 100 equals an entire deviation from the index. Statistically, anything below an Active Share score of 60 means the mutual fund manager is a closet indexer.

Screen Shot 2014-10-28 at 2.39.09 PM


Many of the biggest and most popular mutual funds exhibit Active Share scores close to the 60% mark. This means that many of these funds mostly hold the same exact stocks that an index fund representing the benchmark would hold.


A Closer Look At Closet Benchmarking

I wanted to illustrate closet benchmarking on a graph but when I began looking at the funds above, I couldn’t find one that actually outperformed its benchmark (I gave up after analyzing 14 of them). Instead of visually demonstrating this, let’s explore why a fund manager would choose to do this. Fund managers are under a lot of financial pressure to outperform. Since much of a fund manager’s compensation is tied to assets under management (AUM), they may do whatever it takes to bring in as much AUM as possible. One of the best ways to increase AUM is to advertise outperformance. The only way a fund manager is going to outperform the index is to take a risk and make a bet on a particular stock or sector. If they’re correct on their bet, then their financial incentives dictate they should do anything possible to continue that outperformance. Since this is practically impossible to do in the long term, once they’ve had a success (whether due to luck or skill is highly debatable), they’ll invest very similar to the index to “milk” the outperformance as long as possible. The problem with this is the investors that bought into the outperformance usually do so after the fund manager had their heyday. In effect, all the investor is doing is paying a high price a fund that mimics an index with little incentive to ever outperform again.

The Alternative

Instead of chasing returns where you probably won’t experience the outperformance you thought you were paying for, simply buy the index. You’ll forgo the allure of beating the market, but at least you won’t underperform. An investor can construct a highly diversified portfolio of index funds to achieve their long term financial goals, while adhering to a risk appropriate asset allocation. You can read more how to do this HERE.

Thanks for checking out my blog. If you have questions, please reach out to me!

Wednesday October 22, 2014

Why Your Financial Advisor Should Be A Fiduciary


What if you decided to interview a financial advisor for hire and they said this: I want to help you achieve your financial goals, but I don’t want to be legally required to place your interests above mine because that would be too cumbersome for me to implement and my compensation may be diminished. There may be conflicts of interest that arise from time to time, but I will not disclose them to you. In addition, I don’t want to assume the additional liability that comes with a fiduciary standard. But, I will do my best to help you.

Uhhhmmmmm, ok… We don’t always say what we feel, do we? Unfortunately, financial advisors and their employing brokerage firms would have a tough time convincing folks to do business with them if they adopted a proper fiduciary standard. I didn’t come up with the words above, but I had a nice conversation with a new colleague who did. We chatted about his financial advisory practice and how they avoid potential conflicts of interest with their clients. Here are the important takeaways from my conversation:

1. Only a small percentage of financial advisors are true fiduciaries 100% of the time. Even most Certified Financial Planner (CFP) practitioners, who we are lead to believe are held to a higher standard, aren’t necessarily fiduciaries. In our opinion, only investment advisor representatives of Fee-Only Registered Investment Advisors (RIAs) are true fiduciaries.

2. Consumers can’t articulate how their advisors are compensated. Some advisors earn their living 100% on commissions (think Leonardo DiCaprio in The Wolf of Wall Street), others are compensated solely by fees for advice (Fee-Only), while the majority of advisors want the best of both worlds (for them of course). The trend these days is for advisors to have dual registrations; one as a broker and the other as an advisor. This allows them to charge a percentage of investment assets (such as 1.25%) AND sell you products like insurance, annuities, home loans, as well as earn commissions on investment trades. The conflict with earning commissions is an advisor may recommend a product that pays more via a sales charge versus an alternative that costs the client less such as a no-load mutual fund.

3. Even though its a legal obligation for our firms to act as fiduciaries 100% of the time, we wouldn’t need a law forcing us to do so if one didn’t exist. If all advisors behaved this way, the financial services field would resemble something closer to the medical field (Hippocratic Oath to Patients). Until that happens, most financial advisors will continue to operate within the status quo; as salespeople.

Here’s the short list on how you can tell if your financial advisor isn’t a true fiduciary:

If they recommend you invest versus paying down debt without explaining the expected return on the investment and fail to disclose that the recommendation presents a conflict of interest.

If they recommend you execute a rollover without defining the merits of leaving the 401k where it is.

If they recommend cash value life insurance over term insurance without explaining the pros and cons of each.

If they sell you an annuity without any living benefit guarantees in your IRA.

If they recommend you take the lump sum pension option and invest it versus taking monthly guaranteed income.

If they sell you a deferred annuity the moment your existing annuity is free of surrender penalties.

If your annual reviews are structured around switching to shiney new investments instead of discussing progress towards your goals.

If they recommend mutual funds with sales loads.

If they charge you for a financial plan, then sell you insurance products.


I have adopted the Fiduciary Oath that The Committee For The Fiduciary Standard has set forth. Here are the tenets I have always abided by since I started my own advisory practice:


Screen Shot 2014-10-22 at 9.17.07 AM– I will always put your best interests first.
– I will act with prudence; that is, with the skill, care, diligence, and good judgement of a professional.

– I will not mislead you, and I will provide conspicuous, full and fair disclosure of all important facts.

– I will avoid conflicts of interest.

– I will fully disclose and fairly manage, in your favor, any unavoidable conflicts.


Thank you for reading my post. If any of what I mentioned stirred you up, join the club… I’d love to hear your stories and if you have questions or comments, please reach out to me.


Tuesday October 14, 2014

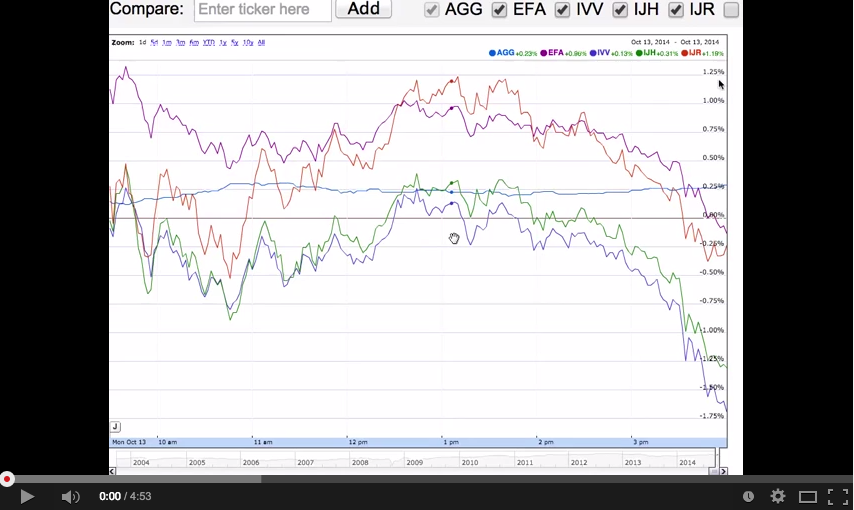
Why You Should Love A Diversified Portfolio: Video

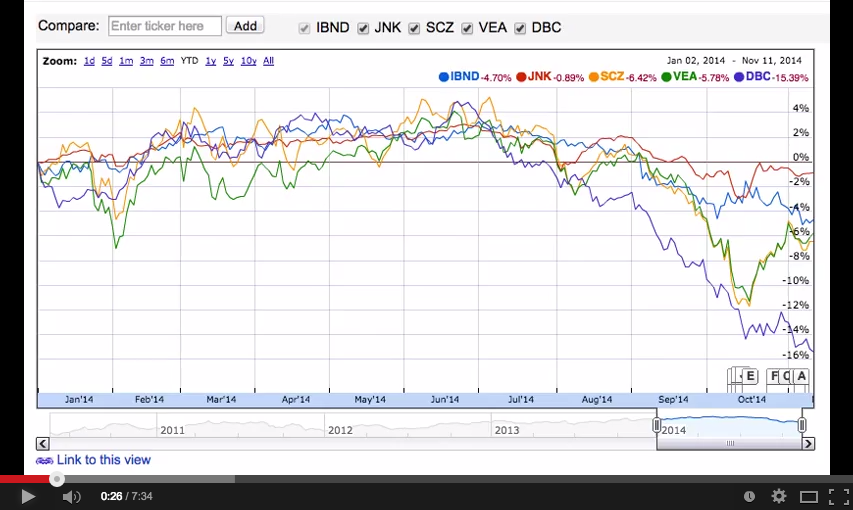
Here’s a short video I made today illustrating how various indices ended on Monday, October 14th. Although US large cap stocks took somewhat of a heavy beating, many of the other asset classes commonly used in any diversified portfolio fared better.

Click the image below to learn why you should love a diversified portfolio during market volatility. Make sure to watch it in HD for best results.

Screen Shot 2014-10-14 at 3.28.13 PM

If you have any questions regarding the underlying rationale for the market’s behavior or if you’re using the correct asset allocation please contact me. Thanks for watching!

Wednesday October 8, 2014

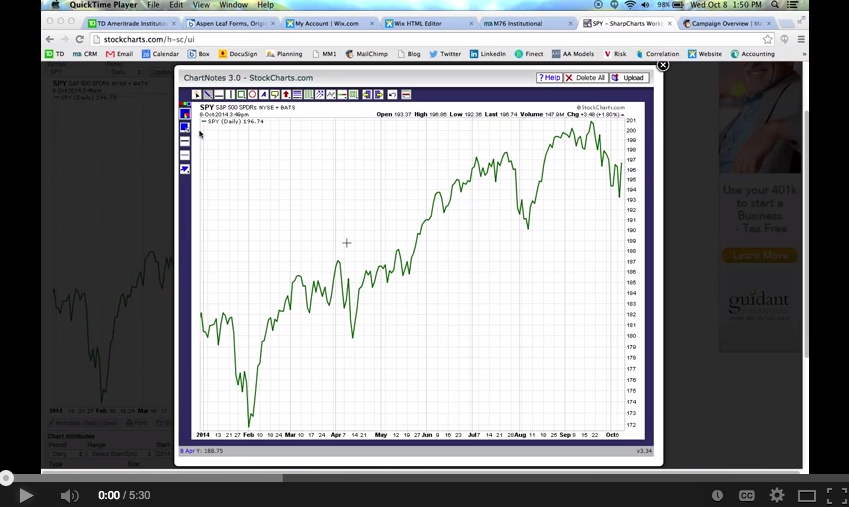
Market Update, October 8th 2014

The market has pulled back about 3% from its recent high point. Slow global recovery is the main culprit driving the S&P 500 down. However, there are a few bright spots including a strengthening dollar, new Federal Open Market Committee meeting notes reaffirming the Central Bank’s intent on prudency with rate increases, and today enjoying the largest one-day gain from US stocks all year. 

Click the image below to watch the analysis. Please watch in HD for best results.

Screen Shot 2014-10-08 at 2.31.19 PM


If you have any questions or feel like a conversation about risk is warranted, please reach out to me. Thanks for watching!

Thursday September 25, 2014

Can You Commit To Your Asset Allocation?


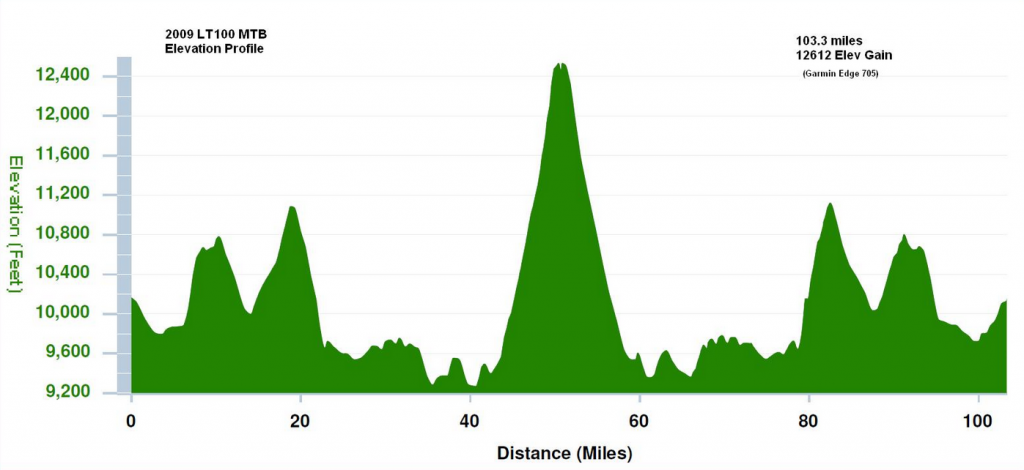
What if the chart below represented the next 12 months of stock market returns?

Screen Shot 2014-10-14 at 3.47.20 PM

You’re actually looking at the elevation profile for a mountain bike race I did last August. I used this graph because I wanted to have a little fun, and there’s no denying it represents a bumpy ride whether you’re on a bike or invested in the market. It’s well known that in order for an investor to achieve a return, one must take risk. Risk is measured by volatility, and it’s how an investor reacts to this volatility that can dictate whether or not they achieve a good long term result.

Let’s assume the market plays out like the chart above. Attaining the top of the big spike in the middle represents the euphoria an investor feels after a stock market run up like the one in the late 90’s, ’03-’07, and ’09-today. Using the horizontal numbers for reference, what happens when an investor gets to mile 52? They usually get a little nervous and start questioning if this dip represents a recession. Once they get to mile 55 they are probably panicking hard, and on the verge of selling to go hide in cash or Treasuries. By mile 58 they are so exasperated they finally sell, and that’s the worse thing they can do.

Even though they feel better, they’ve actually just locked in their losses. So now what? They know they need growth in their accounts, but now they have to decide when to get back in. How long will it take them to regain confidence? Are they ready by mile 70, 85, or 104? The issue with my hypothetical investor is they sold when things were the worst, and waited too long to get back in. The other issue is this investor isn’t all that hypothetical. Investors have been doing this for decades.

An investor needs to understand the potential risks to their investments, and then commit to their asset allocation choice for the long term. Long term in the investment world should represent a time period lasting more than at least 10 years. The first step in determining an acceptable level of risk to take is by completing a risk questionnaire. The point of risk questionnaires is to establish a starting point for an asset allocation decision. Let’s assume the results of the questionnaire suggested an “aggressive” allocation.

The more critical step is to then correctly interpret what the risk questionnaire is suggesting. To accomplish this, let’s assume the aggressive investor adopted a 90% stock / 10% bond allocation model. What would they say when I showed them the historical returns of the recommended allocation?

Screen Shot 2014-10-14 at 4.33.24 PM

The most critical step is to either accept the recommended asset allocation or adjust to a less risky allocation. Many times an investor who is aggressive on paper isn’t actually up for accepting that kind of loss. Risk and asset allocation should be determined by a questionnaire along with a potential real world scenario.

A good financial advisor will not only guide you into an appropriate asset allocation, but they’ll be there when you’re at mile 55 & 60, panicking because you forgot your investment objectives were long term. A good financial advisor truly earns their fee when they help keep you calm during market downturns, and always takes time to explain why your asset allocation is still valid for your risk profile, long term investment objectives, and financial planning goals.

Thanks for reading! Feel free to leave a comment below or reach out to me directly if you have concerns about the investment risk you’re currently taking.


Tuesday September 16, 2014

How To Reduce Taxes Using Exchange Traded Funds

You Can’t Control The Stock Market, But You Can Influence The Taxes You Pay On Investments

Ok sort of… The reality is there’s very little you can control when investing, but you can definitely influence a few important things. One strategy you have control over is what investments you use to manage your taxes. This post will focus exclusively on how using exchange traded funds (ETFs) versus mutual funds can help lower your current tax bill, especially capital gains tax. For any of the following to matter, it helps if you are in a tax bracket that actually taxes investment dividends, interest, and capital gains. Let’s begin with an overview of tax rates and brackets. In 2014, a married filing jointly taxpayer earning less than $73,800 will reside in the 15% tax bracket. If you’re a single taxpayer, your number is $36,900. If you think you’ll fly under these thresholds, then stop reading now since none of this applies to you as you’ll pay 0% tax on investment capital gains, dividends, and interest. Wait, there’s more tax jargon we have to pay attention to first… If you end up with a Modified Adjusted Gross Income of more than $250,000 in 2014, then you’ll likely have to pay an additional 3.8% in addition to your 15% capital gains rate. This extra 3.8% is called Net Investment Income Tax, and it’s levied to help pay for the subsidies available within the Affordable Care Act. If you are married filing jointly and end up in the top tax bracket (making over $457,601), then you’ll pay a capital gains rate of 20% plus the additional 3.8%. Next, we have to understand whether or not ETF dividends are qualified (underlying shares in the ETF held by the ETF for more than 60 days) or non-qualified dividends (those that don’t qualify for qualified status, duh). Most domestic ETFs are structured so that the dividends they pay out to shareholders are qualified, and if you’re married filing jointly making between $73,800 and $457,601, you’ll pay 15% on qualified dividends. Remember that if you’re married filing jointly and have a Modified Adjusted Gross Income over $250,000, you’ll pay that pesky 3.8% Net Investment Income Tax on top of the 15%. Last, we have to account for dividends that bond ETFs pay. These dividends ultimately come from the bond’s interest income within the ETF, and although its called a dividend, it’s technically taxed as interest and ordinary income tax rates apply. 

Let’s Examine The Capital Gains Scenarios Between An ETF Investor Versus A Mutual Fund Investor

One investor holds $100,000 in a stock based mutual fund and the other holds $100,000 in a stock based ETF. Let’s assume the mutual fund is similar to the ETF in holdings, and therefore the dividends and interest are the same. However, an ETF investor can come out significantly ahead of the mutual fund on the amount of internal capital gains the funds pass onto to investors. This fund mechanic is called “turnover”. Fund turnover can be defined as the total amount of new stocks bought, or amount of stocks sold (whichever is less), over a 12 month period divided by the share price of the fund. Let’s assume both investors are married filing jointly and have a Modified Adjusted Gross Income of $200,000 (15% long term capital gains rates apply with no other IRS tax monkey business). We’ll also assume the mutual fund manager has a turnover percentage of 0.85% since this is probably close to the average. I’ll use the ETF ticker symbol (IVV) and it’s turnover of 5% as a comparison. Although a few of the stocks making up the index are swapped out each year, an investor has not seen a long or short term capital gain distribution because the small amount of capital gains resulting from sells within the ETF and its underlying index were passed onto the investor as dividend income. Last, we’ll assume each investment returned 9.5% (average stock return since 1928) last year. Check out the difference in the capital gains tax liability passed on to the investor:

Screen Shot 2014-10-14 at 4.21.39 PM

So in this example representing the averages, the investor ended up paying an extra $1,211 in capital gain taxes just by owning an actively managed mutual fund. The investor didn’t even sell any of the fund, yet they still got clobbered with capital gains! I even did the mutual fund in the example a favor by assuming 100% of the capital gains were long term (15% tax rate), versus short term (ordinary income tax rate). Realize that the 5% turnover of the ETF did transfer away from capital gains to dividend income, but because the percentage is so low, the investor didn’t realize a considerably higher amount of taxable dividend income compared to the mutual fund. We’ll tie all this confusing dividend and capital gain taxability together next.

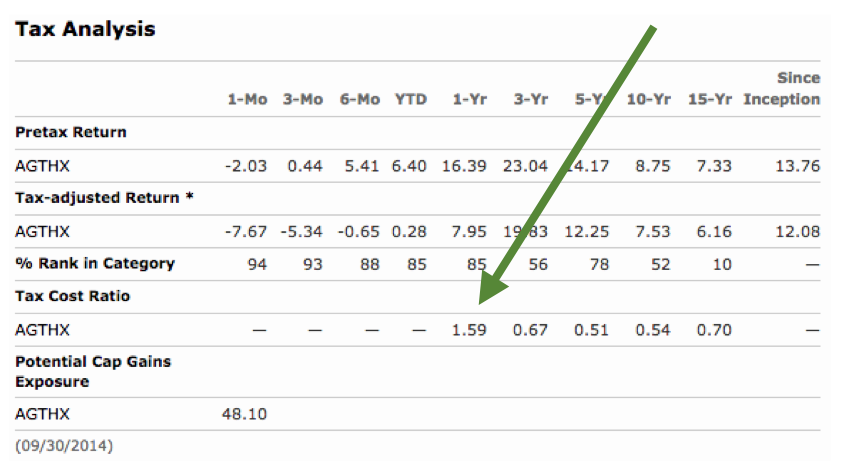
Another way you can measure how tax (in)efficient a fund is with a metric called the tax cost ratio. Morningstar currently makes this available, and it’s free. Just type in the fund name or ticker symbol on their website, then click the “Tax” tab. Here’s a screenshot.

Screen Shot 2014-10-14 at 4.27.30 PM

Sometimes I pick on the Growth Fund of America because my wife and I owned it for years without questioning tax efficiency. In the summary above, you can see the fund had a 1 year tax ratio of 1.59. This means that on average, over the last year an investor paying 15% capital gains taxes would have lost 1.59% of their return to taxes! For example, if your mutual fund returned 10% last year and have a tax cost ratio of 1.59%, then your real return after taxes was actually 8.41%. Using the same ETF (IVV) as a comparison, it has a tax cost ratio of 0.45%. Clearly, the ETF investment structure proved advantageous by over 1% to the investor. 1% over time can add up!

The bottom line here is risk, return, and cost are all important factors when selecting an investment, but as we’ve seen it isn’t wise to disregard the tax cost of a mutual fund in a taxable account. If you have a taxable account full of actively managed funds, please don’t just go sell all of them and buy ETFs without doing a bit of homework. There are several assumptions built into my scenarios above, so check your tax records for your cost basis or check in with your tax advisor to see what the impact of selling your funds would be. You may find it’s worth it to spread out the sells over a few years so you don’t feel blown up with capital gains. Everyone’s investment and tax scenarios are different, and most likely not exactly the same as the hypothetical investor above. If you’d like me to help you better understand your specific situation, please leave a comment or visit the Contact page of my firm’s website.

Page 2 of 3123